Tableau Mastery: Skyrocket Your Business with Data
Escape the Matrix or Stay Trapped. Tableau is your ticket to outsmart competitors, crush weak decisions, and build wealth. Don’t sleep on this—master data visualization and analytics now, or watch oth...
Ready to start learning?
Sign in or create an account to enroll in this course.
One-time payment
About This Course
What You’ll Own:
- Data Domination: Transform raw numbers into visuals that win deals and dazzle clients.
- Tableau Takeover: Master Tableau’s interface to create pro-level dashboards in days.
- Killer Visuals: Build charts, heatmaps, and scatter plots that make businesses beg for your skills.
- Analytics Edge: Use calculated fields and text analysis to uncover insights that make money.
- Storytelling Power: Craft interactive dashboards that sell your ideas to bosses, investors, or customers.
- Real-World Wins: Connect to Kaggle datasets and build analytics for sales, marketing, or Startups growth.
- Community Hustle: Join Tableau Public to showcase your work and unlock global opportunities.
Who Needs This?
- Beginners with Guts: No experience? No excuses. Start now, win fast.
- Analysts and Hustlers: Turn data into your superpower for promotions or side gigs.
- Entrepreneurs and Startups: Skyrocket your business with visuals that close sales.
- Career Climbers: Become the go-to analyst employers can’t ignore.
No skills needed. Just hunger to succeed.
Why You Can’t Wait:
- No BS: Hard-hitting lessons, no fluff, built for results.
- Profit-Driven: Create dashboards that boost revenue—now, not later.
- Elite Tool: Tableau, the weapon of top analysts and businesses.
- Forever Access: Learn fast, win forever with lifetime updates.
Miss This, Lose Big: Without Tableau, you’re stuck guessing while others cash in. Master data viz to crush it as an analyst, grow your Startups, or launch a side hustle. Enroll now—or stay in the matrix.
Buy Now. Win Now. Don’t Regret Later.
Course Curriculum
Introduction to Data Visualization
Students will understand the importance of data visualization, learn about different chart types, and compare basic and advanced visualizations to enhance their analysis.
Why Data Visualization is Important
Examples of Effective Data Visualizations
Types of Charts and Visualizations
Comparing Basic and Advanced Visualizations
Getting Started with Tableau
Students will learn to install and navigate Tableau, connect to datasets like Kaggle, and prepare data for analysis while exploring the Tableau interface for the first time.
Introduction to Tableau
How to Download and Install Tableau
Understanding the Tableau Interface
Connecting to a Dataset (e.g., Kaggle Dataset)
Preparing Data for Visualization
Creating Basic Visualizations
Students will create basic charts, use filters to refine data, and build simple dashboards, gaining essential skills for data visualization in Tableau.
Building Basic Charts in Tableau
Using Filters and Exclude Options
Advanced Charts and Tooltips
Understanding the Dashboard Interface
Creating a Simple Dashboard
Applying Filters in Dashboards
Advanced Visualizations in Tableau
Students will master advanced visualizations like scatter plots and heatmaps, use calculated fields, and design professional dashboards for impactful presentations.
Connecting Sales Data for Visualizations
Creating Advanced Bar Charts and Line Charts
Building a Trend Scatter Plot
Using Calculated Fields for Insights
Visualizing Data with Heatmaps
Building a Box Plot
Text Analysis and Advanced Dashboards
Students will analyze text data, create advanced dashboards with filters, and use Tableau’s storytelling features to craft compelling data narratives.
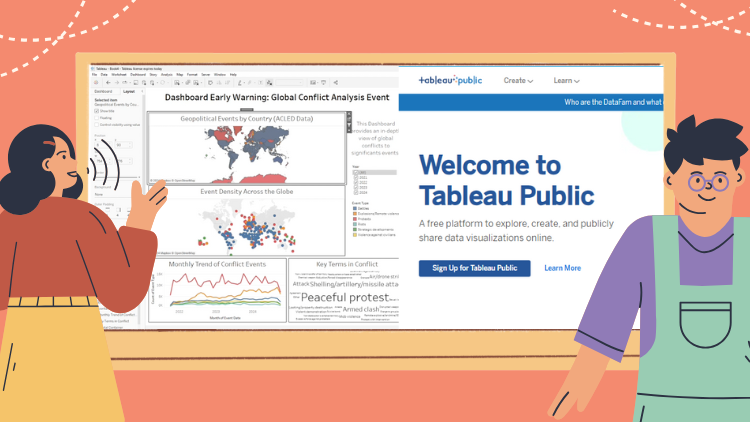
Connecting to ACLED Data for Text Analysis
Creating World Map Visualizations with Filters
Building a Dot Map Visualization
Visualizing Monthly Trends
Using Word Clouds for Text Analysis
Creating and Filtering Advanced Dashboards
Using Tableau Stories for Data Storytelling
Advanced Features and Tableau Community
Students will join datasets, share visualizations on Tableau Public, and access Tableau's community resources and support to advance their skills.
Joining Data in Tableau for Deeper Insights
Sharing Visualizations on Tableau Public
Engaging with the Tableau Community
Getting Support and Additional Resources
Summary and Next Steps
Your Instructor

Escape Matrix Academy
Founder and mastermind behind Escape Matrix Academy. From crafting AI-powered tools to launching sta...